B1 Marker Scenario (IMAGE Model)
National Institute for Public Health and the Environment (RIVM)
Bureau for Environmental Assessment
P.O. Box 1, 3720 BA Bilthoven, The Netherlands
For comments: Bert.de.Vries@rivm.nl
Bert de Vries, Johannes Bollen, Michel den Elzen, Arjen Gielen (CPB), Marco Janssen, Eric Kreileman, Jos Olivier
with contributions from:
Joost Bakker, Marcel Berk, Rik Leemans, Rob Swart
To the reader:
In this web site-report, we present in the results for the B1 scenario as simulated with the IMAGE2.1 model. More information can be gained from the authors upon request.
1. General description
The present trends of globalization and liberalization continue but there is a strong commitment among national and international governments towards sustainable development initiatives. Successful institutional innovations allow many problems that are currently hard or difficult to resolve to fall within the competency of both governments and non-governmental organizations. A more equitable income distribution, both within and between regions, is seen as a precondition for sustainable development.
The B1 world invests a large part of its productivity gains in equity, social institutions, and environment protection. The affluent regions develop consistent and effective ways to support sustainable development in the poor regions, technology transfer agreements being one of the instruments. Some of these regions are taking the lead in experimenting with new ways of income distribution. Rising affluence and intercultural exchange cause a growing interest in the non-material aspects of life, showing up in the form of declining working hours, clean-design technologies, recycling, and the like. Teleworking, internet-oriented education and info/entertainment, public-transport-oriented travelling, use of labor-intensive services for care of children and elderly lead to less energy- and materials-intensive consumption and production patterns (‘dematerialization’). Technology development and life-style trends incorporate ever more the principles of sustainable resource use. Because business takes an active role, the pace of technological innovations is high and RD&D-expenses approach 2 percent of GWP. The transition from traditional to modern economic activities throughout the world proceeds faster than it has historically. Labor productivity continues to rise throughout the 21st century.
2. IMAGE-based simulation results for the B1 scenario
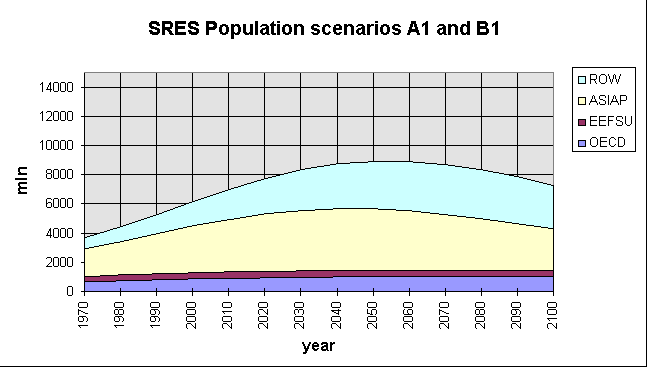
For population we use an exogenous trajectory agreed upon within the SRES-team (Figure 1. The population trajectory in the B1 scenario is about equal to the one in the A1 scenario. GDP per capita is assumed to grow fastest in the Less Industrialized Regions - hence, considerable income convergence takes place (Figure 2). Gross World Product (GWP) is in 2100 in the order of 330 1012 $/yr.

Figure 1 Population trajectory in the B1 scenario
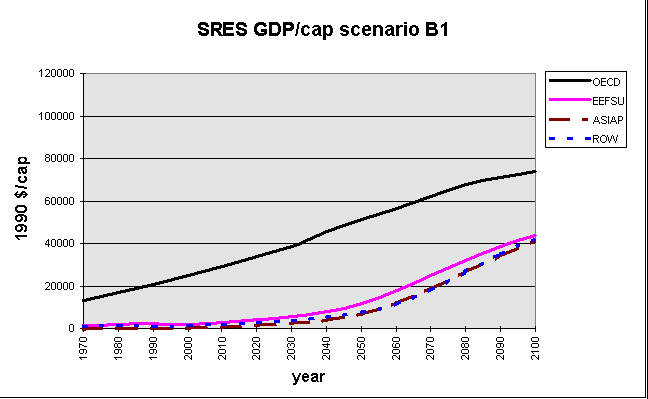
Figure 2 Trajectory for Gross Regional Product (GRP) per capita in 1990 $ in the B1 scenario for 4 regions
The Useful Energy Intensity (UEI), that is, the energy service demand per unit of activity, is declining significantly. It drops in the industrial sector with 40-50 percent over the next 100 years in the OECD-regions. In the less industrialized regions it first rises to a maximum between 1990 and 2040 after which it starts falling. Transport developments follow the present USA mobility and modal patterns, with a modest penetration of electric vehicles and slightly lower energy-intensity in more densely populated regions. Residential and commercial energy-intensity follow a similar course albeit at much lower levels.
The Autonomous Energy Efficiency Improvement (AEEI) is high in the B1 future: for the leading regions (OECD) the rate of AEEI peaks at 1.7 percent per year instead of 1.5 percent per year around 2010-2020 in regions such as Eastern Europe, India, China and Africa. This reflects a globalized world with large rates of technology transfer to realize a high AEEI despite a somewhat lower rate of capital stock turnover. On top of the AEEI, there is a Price-Induced Energy Intensity Improvement (PIEEI) which is in some regions for non-electricity significant in the B1 scenario because of the assumedly smaller oil and gas resource base and the high perceived price of coal. For electricity the PIEEI remains low because of low price-responsiveness and the penetration of cheap non-fossil options which stabilize the over-all electricity generating costs.
In combination with efficiency increases in the energy supply system, there is a considerable decline in the energy-intensity of the economy, defined as the ratio of primary energy and GRP (Figure 3). The average decline in energy-intensity in MJ of primary energy use per unit of GRP ranges from 0.9 percent per year (Japan) to 3.4 percent per year (China). For the OECD-regions the AEEI over the next 100 years is an average of about 1 percent per year. At the other extreme are regions such as China, India and the Eastern Europe / CIS for which the over-all energy intensity is calculated to drop with a factor 20-50 or 2-4 percent per year. Most of this decline occurs between 2000 and 2050. The constituent factors are an AEEI-rate of 1-1.5 percent per year in the next few decades, a dematerialization in the industrial sector thereafter of 2-3 percent per year, an increasing role for the five times less energy-intensive service sector, and an improvement of conversion efficiencies in the order of 0.3 percent per year. Bottom-up engineering analyses suggest that the 50-60 percent decline over the next 2-3 decades in the LIC are technically feasible for the group of energy-intensive products and processes. These figures should be interpreted cautiously, as they are based on GDP in constant $ as the measure of activity.
World end-use energy service demand increases from the present 200 EJ/yr to 500 EJ in 2050 and leveling off afterwards to 740 EJ in 2100. Final energy demand in the form of secondary fuels and electricity is somewhat higher because of conversion efficiencies (Figure 4). Notable is the large increase in the proportion of electricity.
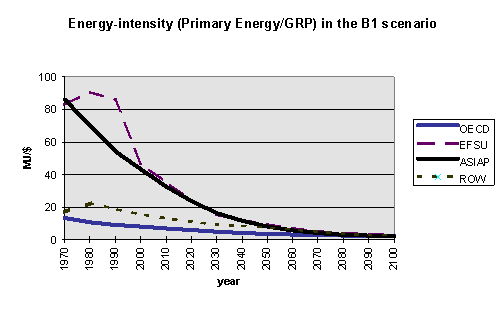
Figure 3 Simulated decline in regional primary-energy-intensity (IMAGE-results)
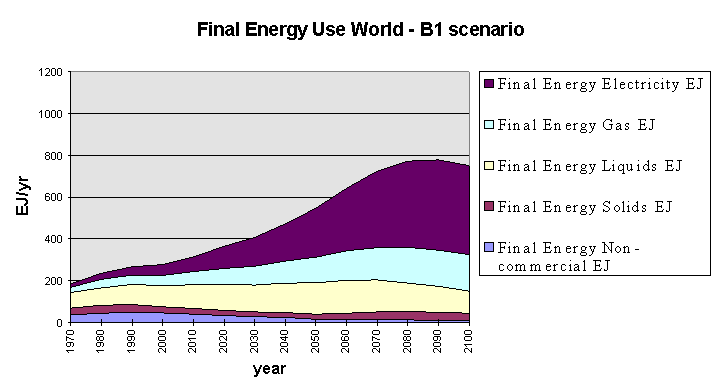
Figure 4 World final energy use in the B1 scenario (IMAGE-results)
The electricity generation system undergoes major changes in the B1 scenario. The fraction of electricity in total useful energy demand rises significantly, to values between 30 percent (OECD-regions) and 60 percent (Latin America and India). Africa and India have the largest installed capacity (5600-6200 GWe) by the end of next century. In most regions the dominant role of non-fossil options becomes quite outspoken: USA (80 percent), OECD Europe (75 percent), Latin America (90 percent), India (85 percent), East Asia (95 percent) and Japan (90 percent). In China and Africa fossil fuels are gradually phased out after 2050 and non-fossil options penetrate to 90 percent by 2100. Even in the Middle East oil and gas supply decline after 2050 and non-fossil options take over. The main driving force is the highly successful development of solar and other non-fossil options: their costs fall to levels of 3-4 cents/kWhe by 2060, in combination with the supposedly much smaller and more expensive oil and gas resource base. The rapid penetration of non-fossil options is also due to rising coal prices which prevail as coal is experienced increasingly as uncomfortable and polluting - in line with strong acid rain abatement strategies. An alternative interpretation could be that clean coal development causes secondary fuel prices to go up.
With regard to the fuel supply side, the rather small oil and gas resource base induces a significant increase in their production costs as depletion continues. The rates of technological innovation in energy efficiency and production from non-fossil options are high thanks to active government support and R&D by multinational firms, and hence larger markets and faster learning-by-doing. This, in turn, slows down the oil and gas depletion rate.
The cost of coal remains below 1-2 $/GJ in almost all regions due to the combination of low demand and expansion and innovation of surface coal mining. Coal trade rises to over 40 EJ by 2070, about twice the present level. The costs to produce crude oil remain below 2 $/GJ in the next century for the big producers, but Japan, Eastern Europe and later on India+ and Africa and East Asia see oil production costs rise to 5 $/GJ and more. Oil trade does not exceed 65 EJ/yr, the Middle East and later on CIS being the major exporters. The USA, OECD Europe and Japan remain the largest crude oil importers but after 2020 the share of China+, India+ and East Asia rapidly increases to over 50 percent of total imports. The cost to produce Liquid Biofuels (BLF) drop in several regions to 3-8 $/GJ, with Latin America and Africa the major producers and exporters. Total BLF use is growing to almost 50 EJ by 2090 with India+ the major user.
Gas production costs rise in gas-poor regions like Africa, China and India, but in the major producing regions costs remain below 1 $/GJ and well below oil production costs. World gas trade increases smoothly to almost 35 EJ/yr by 2060; Western Europe and India are the major importers. Africa and Latin America and later on the Asian regions become leading producers of commercial Gaseous Biofuels (BGF) at costs below 4 $/GJ; rising marginal costs and declining demand stabilize production and use at worldwide some 80-85 EJ/yr for gaseous biofuels.
World primary energy use reaches almost 900 EJ/yr before it starts declining (Figure 5). Renewable sources (solar photovoltaicsm biofuels a.o.) become dominant in the second half of next century. Almost all of the increase in primary fuel use takes place in the non-OECD-regions (Figure 6). Cumulated fossil fuel use equals roughly the 51.000 EJ resource base of conventional resources, so transition problems after 2100 will arise if unconventional occurrences do not become available at acceptable costs.
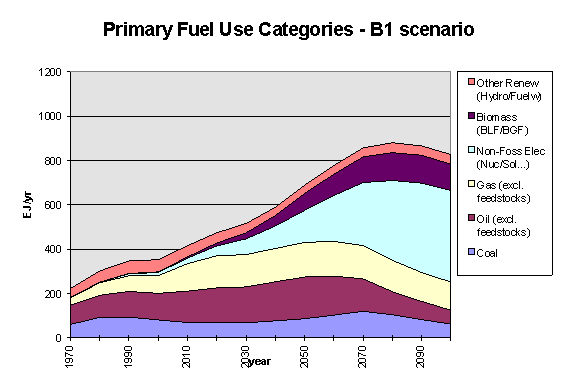
Figure 5 World primary energy use in the B1 scenario (IMAGE-results) - categories
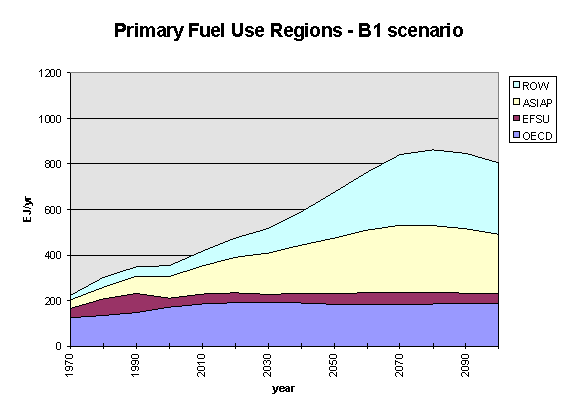
Figure 6 World primary energy use in the B1 scenario (IMAGE-results) - regions
Total carbon emissions slowly rise to maximum of 12 GtC-equivalents between 2060 and 2070 (Figure 7). The CO2-emissions from fossil fuel burning and deforestation peak at about 10 GtC between 2060 and 2070. The contribution from non-CO2-greenhouse-gases amounts to about one third to one fourth. The CO2 emissions from fossil fuel burning peak at about 9.5 GtC/yr around 2060 after which there is a decline to 1990-levels (Figure 8). The increase is largely happening in the ASIA- and ROW-regions, whereas the Annex-1 regions show a significant reduction.
As a consequence of these emissions, the CO2-concentration in the atmosphere rises to about 600 ppmv (Figure 9). The calculated resulting temperature rise is shown in Figure 10.
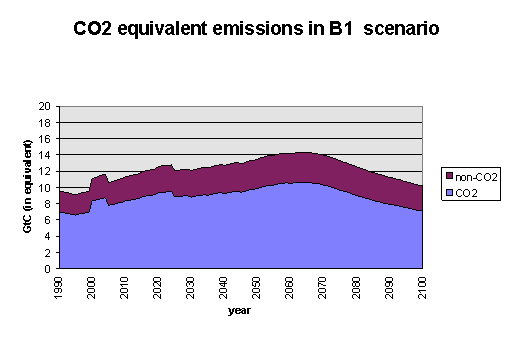
Figure 7 CO2 emissions and non-CO2 (equivalent) emissions in the B1 scenario (IMAGE-results)
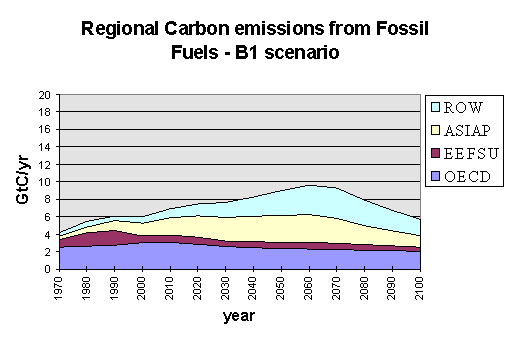
Figure 8 Regional CO2-emissions from fossil fuel burning in the B1 scenario (IMAGE-results)
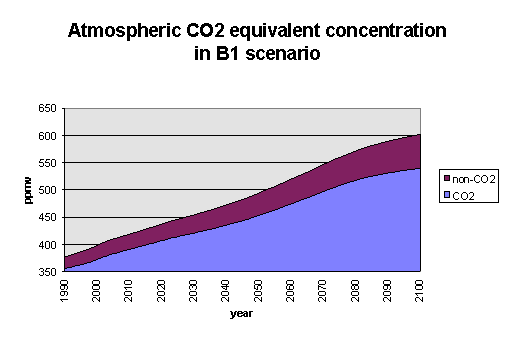
Figure 9 Atmospheric CO2 concentration and non-CO2 (equivalent) concentration in the B1 scenario (IMAGE-results)
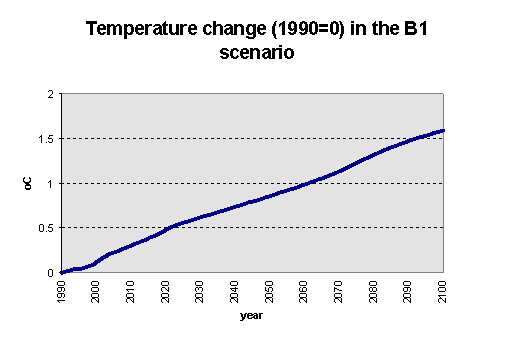
Figure 10 Change in average global surface temperature above 1990-level in the B1 scenario (IMAGE-results)
Literature
Alcamo, J., E. Kreileman and R. Leemans (Eds.) (1998). Global change scenarios of the 21st century. Results from the IMAGE 2.1 model. Elseviers Science, London
Alcamo, J., A. Bouwman, J. Edmonds, A. Grübler, T. Morita, A. Sugandhy (1995). An Evaluation of the IPCC IS92 Emission Scenarios (ch. 6). Climate Change 1994. Cambridge, Cambridge University Press. 338.
Alcamo, J. (Ed.) (1994). Integrated Modelling of Global Climate Change: IMAGE 2.0, Kluwer Academic Press, Dordrecht/Boston/London.
Berk, M. and M. Janssen (1997). The Interactive Scenario Scanner (ISS): a Tool to Support the Dialogue between Science and Policy on Scenrio Development Version 1.0. RIVM Report no. 481508005. Bilthoven
Bollen, J. C., A.M.C. Toet, H.J.M. de Vries and R.A. van den Wijngaart (1995). Modelling regional energy use for evaluating global climate scenarios. RIVM Report no. 481507010. Bilthoven
Bollen, J.C., A.M.C. Toet and H.J.M. de Vries (1996). "Evaluating cost-effective strategies for meeting regional CO2 targets." Global Environmental Change 6(4): 359-373.
Fiddaman, T. (1997). Feedback Complexity in Integrated Climate-Economy Models. MIT Sloan School of Management. Ph. D. Thesis
Geurts, B., and H. Timmer (1993). World Scan - A Long-Term WORLD model for SCenario ANalysis. Central Planning Bureau (CPB)
Klein Goldewijk, K., and K. Battjes (1995). The IMAGE 2 Hundred Year (1890-1990) Data Base of the Global Environment (HYDE). RIVM Report No. 481507008. Bilthoven
Kroeze, C. (1995). Fluorocarbons and SF6 - Global emission inventory and options for control. RIVM Report no. 773001007. Bilthoven
Rotmans, J. and H. J. M. de Vries (Eds.) (1997). Perspectives on global futures: the TARGETS approach. Cambridge, Cambridge University Press.
Vries, de H.J.M., and R. van den Wijngaart (1995). The Targets/IMage1.0-Energy (TIME) model. RIVM Report no. 461502016. Bilthoven
Vries, H. J. M. de, and M.A. Janssen (1996). Global energy futures : An integrated perspective with the TIME-model. RIVM Report no. 461502017. Bilthoven
Appendix A IMAGE 2.1 Regions:
For reporting, there has been an aggregation into 4 regions: OECD (=IMAGE 1+2+5+12+13), Eastern Europe and Former Soviet-Union EEFSU (=IMAGE 6+7), Asia Pacific ASIAP (=IMAGE 9+10+11) and Rest of World ROW (=IMAGE 3+4+8).